class: center, middle, inverse, title-slide .title[ # Introduction to WebMaps ] .subtitle[ ## Lesson 1: Theory, practices and required skills ] .author[ ### Dr. <strong>Cyrille Médard de Chardon</strong> ] .institute[ ### <br>University of Luxembourg &<br>Luxembourg Institute of Socio-Economic Research (LISER) ] .date[ ### <br>Last update April 24, 2023 ] --- class: # Names, pronouns and the Climate Crisis .pl[ Let's do a quick round of introductions. Please let me know your name and pronoun preferences. *I'm Cyrille, I go by 'he, him, his' pronouns.* ] .pr[ 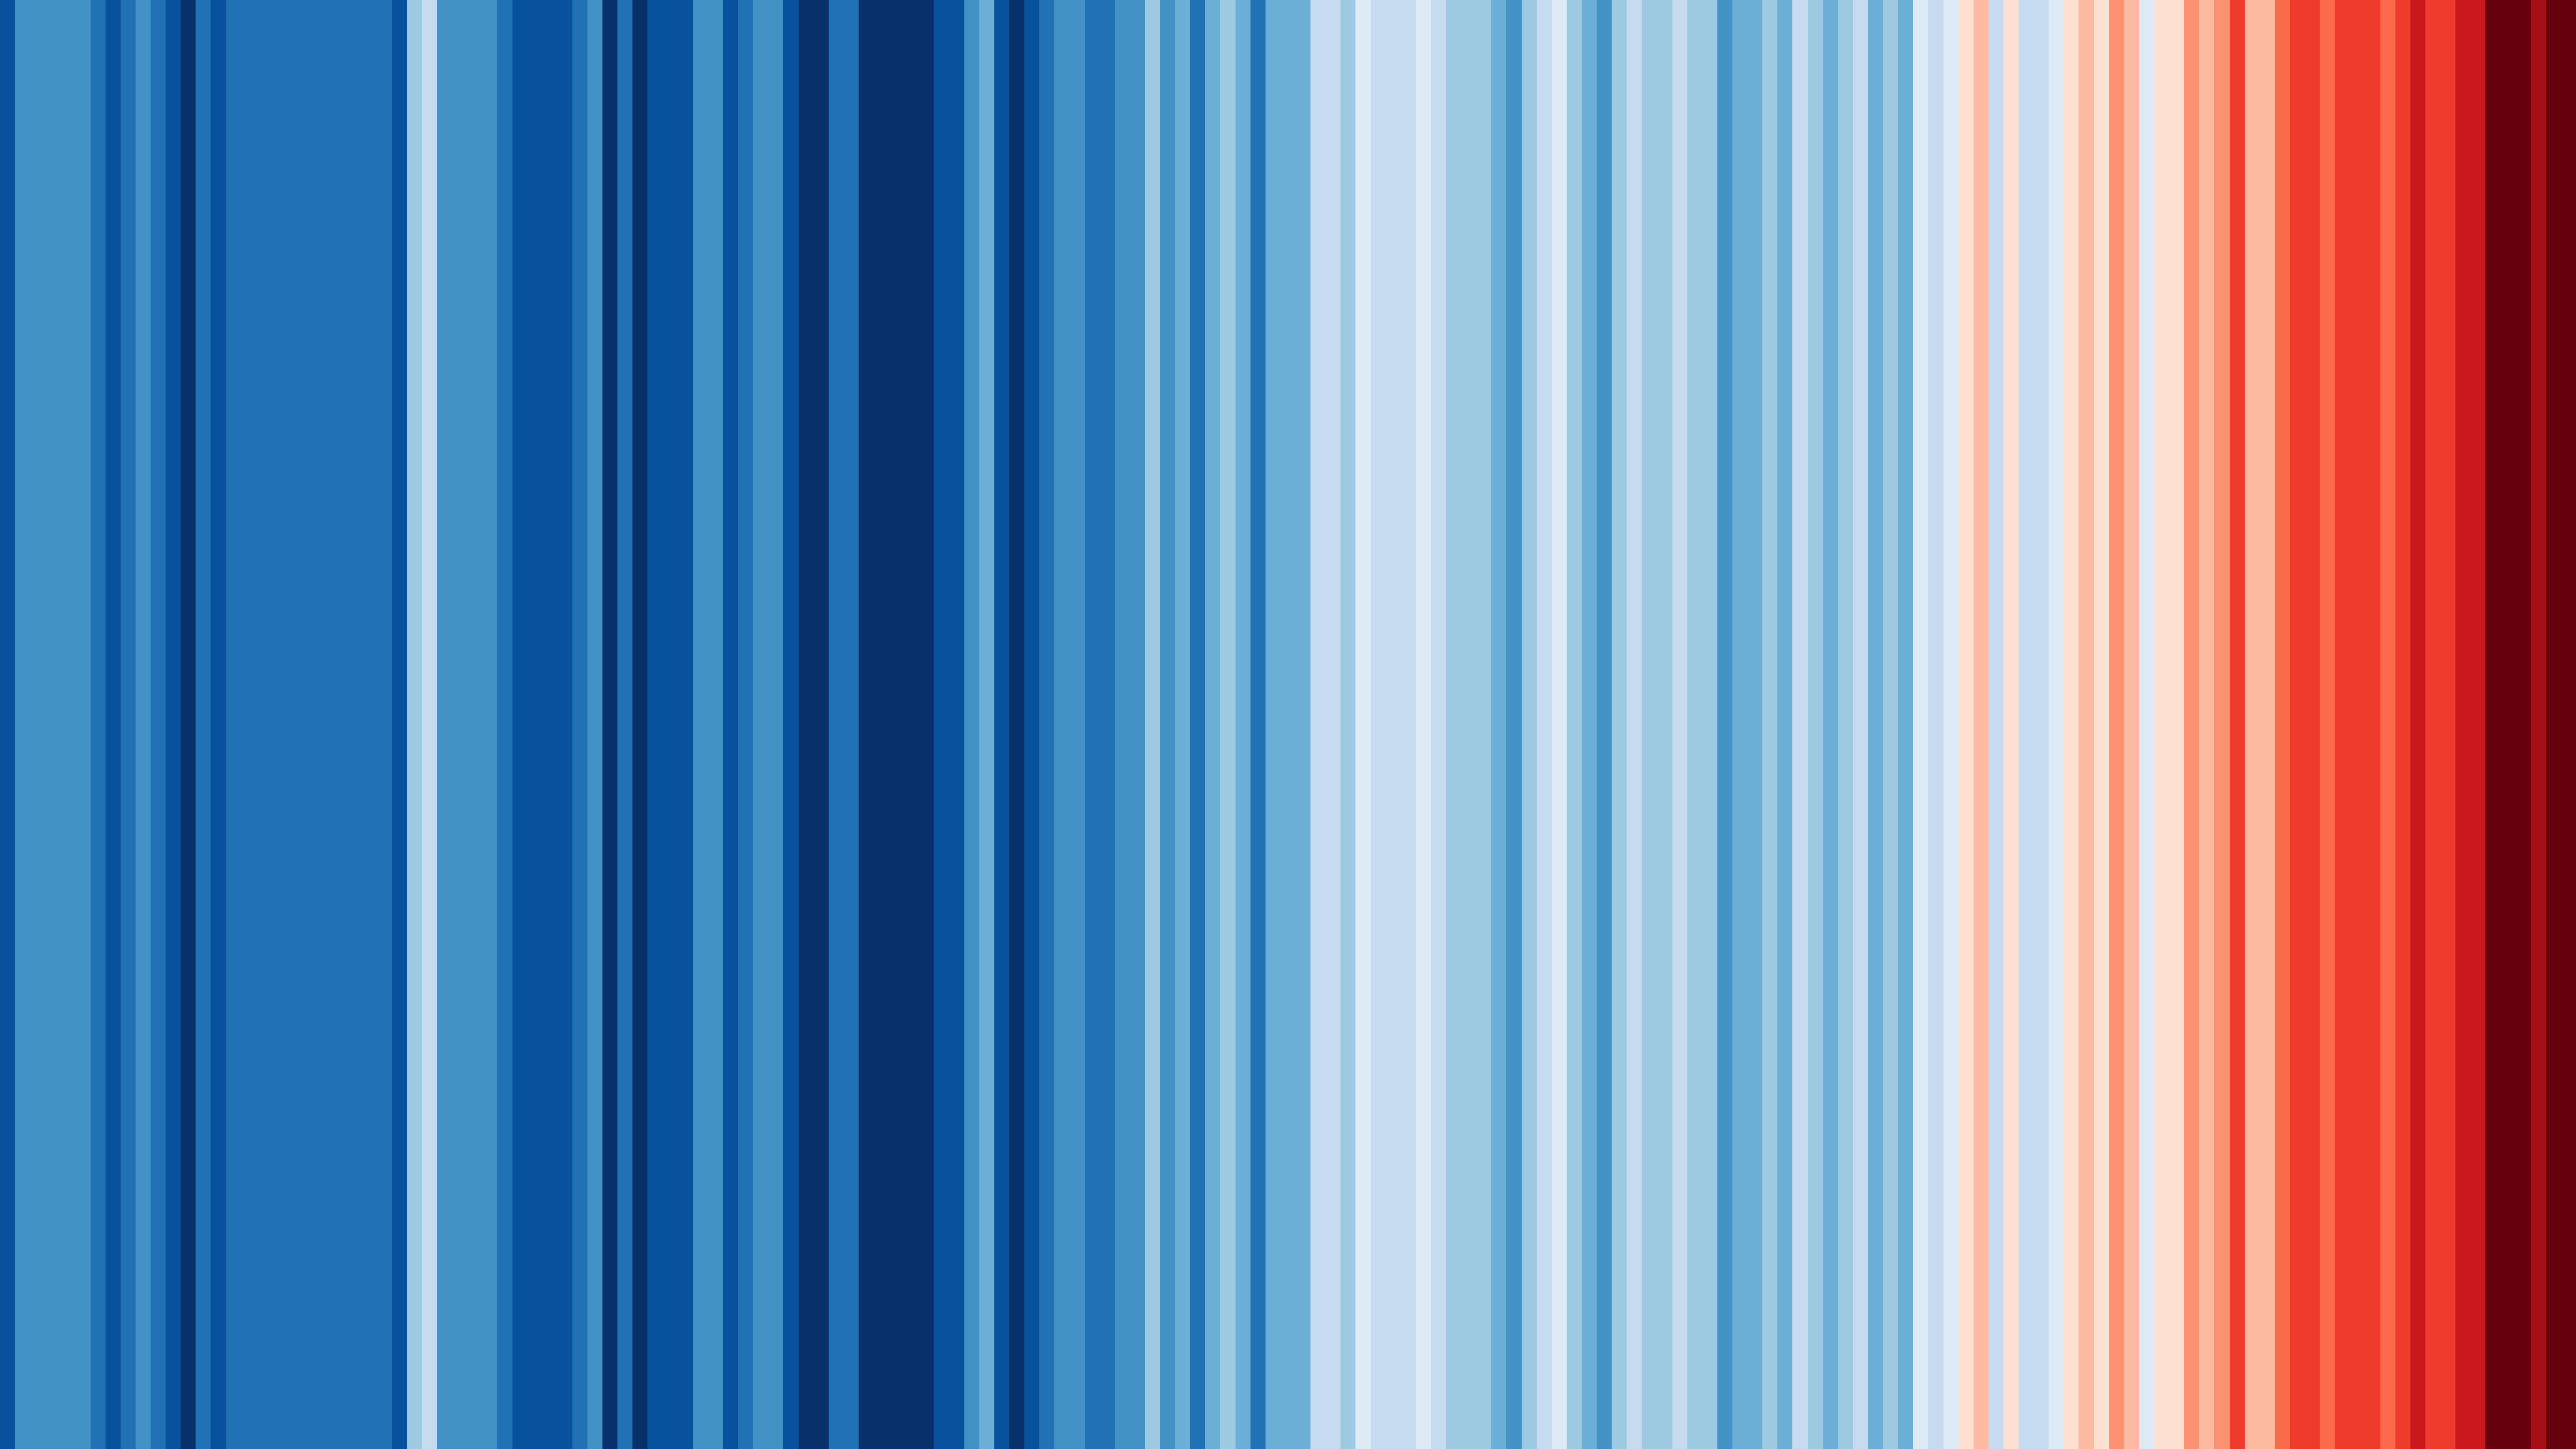 We must acknowledge the current [climate crisis](https://acknowledge-the-climate-crisis.org/) in our everyday activities. .source[Global temperature 1850-2020 #ShowYourStripes - Ed Hawkins (University of Reading).] ] --- # WebGIS subsection outline .pl[ ## The course The course is divided into four lectures of 2-3 hours of length. The lesson topics are: 1. WebMap theory, practices and required skills 2. Building simple WebMaps and uploading them to a server. 3. Adding feature types and components to our WebMaps. 4. Making WebMaps more informative. ] .pr[ ## This lesson - What are WebGIS and WebMaps? - The evolution of WebMaps from static to dynamic - Types of map services - Limitations - How do WebMaps operate? - The map stack - Skills development - File systems, HTML, CSS, JavaScript, Common data formats - Developer tools - Browser, Coding ] ??? This course explains the underlying functioning of WebMaps and teaches you how to create them. Today we will focus on understanding the dependencies of WebMaps, how and what they need to function. As well as what you need to know and understand to create them. We will start next week with actually making WebMaps. --- # Evaluation for this section of the course .pl[ Each week you will be given tasks. - **They are due before the start of the next lesson.** - Depending on our schedule this may mean you have more than one week to complete the activities. - Each assignment will have points. - Points are summed across all four lessons. - Your WebGIS grade contributes to a **part** of your overall course grade. ] .pr[  .source[[Stańczyk](https://en.wikipedia.org/wiki/Sta%C5%84czyk_%28painting%29), by [Jan Matejko](https://en.wikipedia.org/wiki/Jan_Matejko).] ] --- class: inverse, middle, activity # What is a GIS? ## In pairs/groups determine four or more components of a GIS. ### You have one minute. --- # A GIS ## Definitions will vary, but ... .pl[ Typically a GIS consists of 4 hardware and software components*: - hardware (PC/server), - software, - data (geographic/spatial), and - methods (input, manipulation, algorithms, management, query and analysis, or visualization) <small>*The ubiquity of computers now makes the hardware requirement a bit obvious and this list dated.</small> ] .pr[ GIS software is typically defined as affording or allowing: - input and manipulation of geographic information - database management system (DBMS) - tools that support geographic query, analysis, and visualization - a graphical user interface (GUI) for easy access to tools ] --- # WebGIS or .pull-left[ .tl[ The definition of a WebGIS is vague. esri used to define it in very **technical terms**: ] - The server has a URL so that clients can find it on the web. - The client relies on HTTP/S specifications to send requests to the server. - The server performs the requested GIS operations and sends responses to the client via HTTP/S. - The format of the response sent to the client can be in many formats, such as HTML, binary image, XML (Extensible Markup Language), or JSON (JavaScript Object Notation). ] .pr[ In simpler, **human terms**, we could define WebGIS as an online map that allows interaction to change the location, scale and potentially features, as well as creating, editing, removing, and other operations present in a GIS. There exists within the above definition a wide spectrum of possibility. ] .source[https://enterprise.arcgis.com/en/server/latest/create-web-apps/windows/about-web-gis.htm] --- # WebGIS and WebMap differences? .pull-left[ Within a <b><span style="color:red">s</span><span style="color:orange">p</span><span style="color:yellow">e</span><span style="color:green">c</span><span style="color:blue">t</span><span style="color:indigo">r</span><span style="color:violet">u</span><span style="color:red">m</span></b> of web-based maps: - there are **static maps/images**, those you generate in ArcMap and export as PDF or PNG. While these can be embedded in HTML online or distributed by PDFs they are constrained to the area, scale and features you have selected. These **fulfil many tasks perfectly** where no further affordances are necessary. - **WebMaps** provide some level of interaction or even animation, these have become extremely common and practical for providing large data sets that cover large areas with detail where individuals can explore small portions of the data at large scale (small areas). **WebMaps are interactive, allow scaling, panning, and querying.** ] .pull-right[ - **WebGIS** are typically built on the same framework as WebMaps but allow some additional operations present in a desktop GIS, such as modifying the data. Note however that that a WebGIS/Map also contain features **exclusive** to a desktop GIS. - A desktop GIS, while it may appear as the most powerful way to view and manipulate data, it has certain limitations. - WebGIS/Maps provide opportunities that are difficult to implement well or as desired from a desktop GIS. With WebGIS/Maps it is easier to create linkages, customization, real-time collaboration, crowd-sourcing, while a desktop GIS is the simplest for geoprocessing, digitizing, volumetric analysis and many other things that don't necessitate repetition or automation. ] --- # GIS, WebGIS and WebMap .pl[There isn’t a consensus exactly. So let’s define our own. **WebMaps are** simple interactive maps allowing you to better explore data than with a static map through interactive panning, scaling, and sometimes querying, with readily or easily available base maps. **A WebGIS additionally allows you to create or change data.** ] .pr[ WebMaps typically provide the following functionalities: - interaction, - scaling, - panning, - browser or app access, - display of data and/or base maps, - and sometimes, querying of features. ] ??? While we've called this course WebGIS we'll really be learning how to create WebMaps alone according to this definition. --- class: inverse, middle, activity # Let's explore this [resource](https://www.gebco.net/data_and_products/gebco_web_services/web_map_service/mapserv?request=getmap&service=wms&BBOX=45,-3,55,10&crs=EPSG:4326&format=image/jpeg&layers=gebco_latest&width=1600&height=900&version=1.3.0) ## What type of resource is it? ### Discuss with your neighbour --- # A WebMap .pl[ When viewing the map, **explore the URL**. You should see some parts that make sense: - BBOX=45,-3,55,10 - crs=EPSG:4326 - format=image/jpeg - width=1600 - height=900 Try making changes to the: - BBOX (location/bounds), - width & height - image format (e.g., format=image/png) ] .pull-right[ .w100[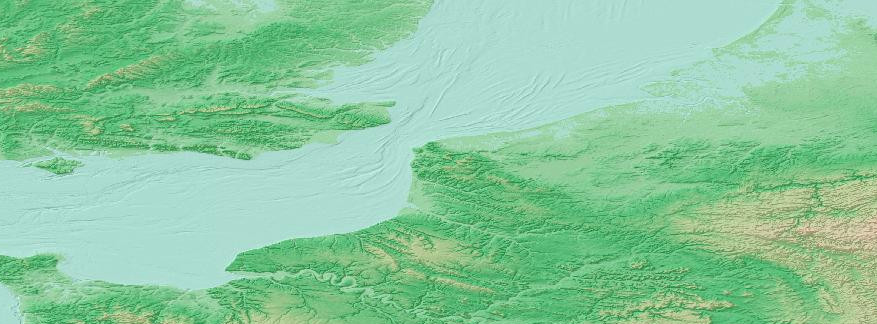] - Interaction is difficult and requires expert knowledge (e.g., lat/lng, image w/h distortion). Nothing happens in the browser besides displaying the map. - While this interface is clunky, there’s still a lot going on in the background on the server. - We will call what happens on the server the **back-end stack**. - What you can do within the browser that can take place without an internet connection, is the **front-end**. .source[https://www.gebco.net/] ] --- # How WebMaps function .pl[ We've seen how a server can generate an image based on a set of parameters (i.e., bbox, width, height). Let's observe some particularities about the loading of WebMaps to further see how some of them they operate. **We will explore a couple maps and try to perceive and reveal some of this underlying functionality.** ] .pull-right[ **Complete the following in pairs/groups.** [Map/activity 1](http://openwhatevermap.xyz/#3/66.93/14.33) - Three minutes - What is going on here? - This is created for fun - but what does it reveal about how this webmap 'functions'? For the next exercise **watch the map carefully** as it loads. Repeat if necessary. [Map/activity 2](http://www.arcgis.com/apps/View/index.html?appid=6f53ca5e2b8c480888e96e5f71929c08) - Three minutes - What components or layers do you see? - What data does the map contain/present? - What data types? (do you remember data types from GIS?) ] --- # Types of Map Services .pl[ Web Mapping Service (WMS)  Web Feature Service (WFS) 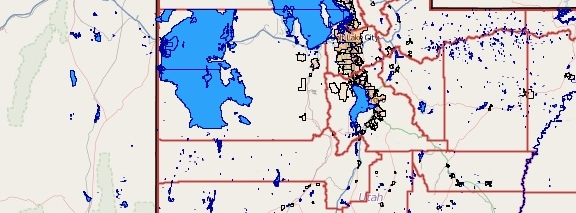 .source[https://www.gebco.net/, OSM Contributors, http://www.deegree.org/] ] .pr[ WMTS/TMS/XYZ .w90[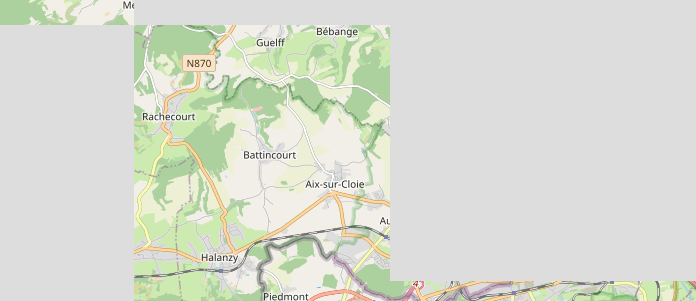] Tiled WFS - WFTS .w90[] ] ??? - WMS (Web Mapping Service): This is similar to what a desktop GIS does, it generates an image of defined bounds and features and displays it to your screen, only this is sent over the internet each time you change scale or pan. This **was** the most commonly used form of WebMaps early on (e.g., the map we saw earlier). Its rare now as it takes processing power and time, making it only worthwhile if there are few requests. - Tiled image maps (WMTS/TMS/XYZ): This was the first big improvement in WMS, allowing much more responsive change in scale and panning. This however is constrained by not containing WFS abilities. There are many standards. - WFS (Web Feature Service): Provide the vector features to the browser, encoded, to display. This has the added potential of allowing the selective display and styling of client side information (e.g., Google Maps advertising). - Vector tiles: It combines the benefits of tiled maps and WFS. - Note that server tile generation can either be done ahead of time or on the fly but that storage becomes and issue as you must save each tile for each resolution. - The internet has changed, asynchronous vs synchronous (web2.0 in the 2000s) - Asynchronism requires a **web server** that processes HTTP(S) requests. **No service is best for all situations**. Some data is better served in raster format, using tiled images, while others can increase speed and reduce bandwidth with vector formats. WebMaps can contain combinations of mapping services. --- class: inverse, center, middle, activity # Activity **Illustrate the path of the data from a server to the user** --- # The stack and its components .pl[ The map services that provide the data are only one (complex) part of the WebMap set of components and data flow. WebMaps depends on a stack of components and sequences of interactions between them. WebMaps can be broken down into **two** physically separated components - the backend/server (somewhere on the internet) and frontend/client (your browser): ] .pull-right[ - The **backend** is a data service you can query to retrieve data from, or send data to. Queries are processed to specify the desired data, gathered and formatted for delivery on the server somewhere on the internet. The first example, [the WMS](), is a good representation of the query, the URL, and the resulting data. - The **frontend** provides an interactive user interface that translates interactions (mouse zoom & pan) into server requests (from the backend) and displays the results. This happens on your computer/device's app or browser. This interaction is provided by a framework or library that treats all content as equal, regardless of whether it is georeferenced (can be used to [explore a painting](https://www.haltadefinizione.com/en/viewer/work/selfportrait-umberto-boccioni)). ] --- # The stack .w100[] ??? ## How the backend functions .pl[ Data services start by receiving a request, a small chunk of instructions defining what someone wishes to retrieve. - Requests are received by a server (Apache is the name of a service that ‘catches’ requests and directs them to other programs in a structured manner). Based on the request path (the URL’s scheme, domain and paths) or file type (e.g., HTML, PHP) the server will send the different content or other data processing programs. - If the content is simply HTML (e.g., readable structured text) or an image it will simply return that content. ] .pr[ - If it is, for example, PHP, it is ‘interpreted’ to complete other actions, such as tell a GIS to process spatial data. - Databases provided structured data (typically in the form of a table, like an an attribute table) based on queries, they can also provide geographic data. Any request that requires geographic features stored in a database will have to flow through all these systems and back up to reply to a request, for each request. This is roughly the process that occurs when you visit the example site shown earlier. ] --- # The frontend and frameworks/libraries .pl[ .pr[.ms[]] Focusing on the process of browsers retrieving and displaying WebMap content. - Let’s use the [Leaflet Library's introductory example](https://leafletjs.com/examples/quick-start/example.html) to explore how browsers, web-content and WebMaps interoperate. - On visiting the site, a request is made to the server to retrieve the HTML page containing textual content and its dependency data and code: formatting/layout/CSS, mapping library/framework, JavaScript/JS, & image tiles. ] .pr[ .w100[] ] ??? Our interactions with internet content is primarily through browsers. However, we also use other programs, such as apps or a desktop GIS with basemaps to retrieve content from the internet. --- # HTML code is free (as in accessible) to learn from .pl[ **Right click** on the blank/white part of the Leaflet example website and select “View page source”. The HTML file points to other resources. You can see this in the `<head>` section. The files are: - Leaflet JavaScript library provides the WebMap ‘smarts’ (interaction, requests) - Leaflet CSS determines the layout of the map content. - Once each of those files are loaded and ‘run’, the browser continues to process the HTML code. ] .pr[ - End of HTML code contains JavaScript `<Script>` code. This code, using the loaded libraries creates the map. The libraries, based on the given location request the appropriate tiles as defined in the code: ``` # latitude, longitude, and scale/zoom setView([51.505, -0.09], 13); ``` - The remaining code simply adds markers, interaction and information to the markers. This sort of JavaScript should be somewhat human-readable. ] ??? These resources will be loaded as soon as possible (when your browser ‘sees’ the line) with new requests. Note these are pointing to another server/domain than that of the HTML file. --- # WebMap components summary .lt[ WebMaps depend on a stack of components: - Servers, directing your request to the applications or resources. - Server applications, responding to requests and potentially generating images/tiles from the database. - The network connections bridging you/client to the server. - The browser, interpreting files for display using a variety of standards, files, and libraries. Within a browser multiple components are combined: - **HTML** to link all the components together - **CSS** for layout - **JavaScript** providing interaction (with users and servers) - Tiles (WMS) or features (WFS) providing the map backgrounds or content ### Review question Why would the map provider (MapBox, Google, OSM) use tiled WMS or WFS? Why would you choose one over the other? ] --- class: inverse, center, middle, activity # 10-minute Break --- # WebMap coding requirements, an introduction .pl[ We will now cover the basics of: - File systems - HTML - CSS - JavaScript - Data formats We won't cover: - Databases - SQL (interface between DB server-side code) ] .pr[ There is an enormous amounts of free, good, and accessible information regarding all these concepts online. I will provide an introduction and we will work with these regularly for the next month. A few resources and good practices will be a huge help: - Your IDE (Notepad++ or Visual Studio Code) - **Keep everything very organized!** - The browser Web Developer Tools (F12) ] --- # File systems .pull-left[ Here are two ways to contact your room-mate 'Tom': .pr[.ms[.w75[]]] 1. You mail them a letter by writing the full address on an envelop and putting it in an outgoing mailbox. 2. You simply put their name on the envelope and place it in **your** mailbox. .pr[.ms[.w75[]]] But if you leave the envelop at your friend’s house, it won’t reach the correct person. .source[Unknown, unknown] ] .pr[ In order to work with HTML, CSS, JS and data we need to understand how resources/files are linked. This is typically done through ‘paths’ that are either: - relative, or - absolute This issue has likely been problematic for you when using a GIS at some point. ] --- # File paths examples .pull-left[ ## Relative Paths Given the file structure shown **to the right**, if I 'point' to the following resources in a file using the relative paths below, **what is the working directory or source file?**: - css/site.css - js/leaflet.js - ../data/poi.json ## Absolute Path examples - https://wwwen.uni.lu/ - https://wwwen.uni.lu/research/fhse/dgeo - C:\Projects\MAGEO\WebGIS\Lab1 - /home/cyrille/public_html/webmap ] .pr[ .w100[] ### Q: How are your files organized? ] --- # The HTML, CSS, JS Trinity .w100[] --- # Introduction to HTML .pull-left[ These are tags and they usually come in pairs: ```html <html> <head> <title>My website</title> </head> <body> <div>Content</div> </body> </html> ``` <hr> Different tags provide certain functionalities by default. - `p` - Creates margins above/below the contained text. - `div` - Contains content in a box that fills the width. - `script` - Expects JavaScript within. - `style` - Expect CSS within. ] .pull-right[ Tags can contains attributes. In this case the **attributes** are named **class**, **id** with values **pop**, **map**: ```html <p class='pop'>Hi</p> <div id='map'></div> ``` There are many possible attribute types. <hr> In the above case we would say the paragraph **has** the class 'pop' rather than speak of attributes and values. Similarly, the div tag **has** the id 'map'. <hr> **Note that**: => **classes** are meant to be applied to MANY elements => **ids** should be UNIQUE. ] ??? HTML links to CSS, JavaScript, images, libraries, and other items. Typically it contains the textual data/content. HTML links to other resources, which may link to further resources downloaded when the page is loaded. Additional data can be asynchronously loaded - such as the WebMap tiles as you pan around. **If you want to make a WebMap that means you want to put content online on a website.** --- # HTML Example .pl[ Let's look at a larger HTML example:  ] .pull-right[.ts[ ```html <!DOCTYPE html> <html> <!-- I am a comment. Browsers ignore me --> <head> <meta charset="utf-8"> <title>About me</title> </head> <!-- Start of the body, where the content should be placed --> <body> <h1>About me</h1> <h2>Me</h2> <img class="askew" src="images/me.jpg"> <h2>My pet</h2> <img class="border" src="images/me.jpg"> <div id="map"></div> <h2>My hobbies</h2> <ul> <li> <!-- This is a link, using the 'a' tag --> <a href="pages/rockclimbing.html">Map of water sampling</a> </li> <li>Ice skating</li> <!-- Add other links and descriptions here using the above as an example --> </ul> </body> </html> ``` ]] ??? In some cases you can’t share a WebMap as easily as you can an image map that you could post on Twitter, Facebook, etc… You will need to have a basic understanding of HTML, and other aspects, in order to do so. --- # Introduction to CSS (Cascading Style Sheets) .pl[ CSS contains styling and layout information for HTML. Before CSS, existing styling would be embedded/mixed in HTML, this would make changing design or content a lot more work. The benefits of CSS are clear. See the [CSS Zen Garden](http://www.csszengarden.com/), **one HTML content file** with different CSS files. ] .pr[ .w90[] ] --- # CSS .pull-left[ CSS can either be placed in an **independent file** or **within the HTML file**. To have the CSS in a separate file link to the CSS file within the existing `<head></head>` section: .ts[ ```html <head> <link href="css/webmap.css" rel="stylesheet" type="text/css"> </head> ``` ] Otherwise, add it in the HTML within a set of `<script></script>` tags: .ts[ ```html <head> <script> a { text-decoration: none; color: purple; } </script> </head> ``` ]] .pull-right[ Larger CSS example: .ts[ ```css /* CSS comments are different than HTML! */ /* The 'a' refers to an HTML tag of type 'a' */ a { text-decoration: none; } /* The '#' refers to an HTML element with id 'map' */ #map { position:absolute; top:0; width:100% } /* The '.' refers to all HTML elements class 'pop' */ .pop { font-size: 1.2em; font-weight: bold; } ``` ]] ??? A reminder that HTML contains content, CSS should make the layout and styling. While it's possible to embed the CSS in the HTML, I recommend keeping it in a separate file. Note that the order in which CSS rules are read impacts them. So if the class 'pop' defines twice what colour it should be, only the second rule will be followed. --- # Introduction to JavaScript .pl[ JavaScript is a scripting programming language (doesn't need further processing to be used). It’s powerful but very easy to create confounding errors/unexpected results. JavaScript is used in this course to to 'create' maps, load content and handle interaction/requests. Most of the complexity is hidden using libraries and **we will mainly be doing configuration**. ] .pull-right[ Create a variable/container and label it with: - `let` (or `var`) Let's create a WebMap: .ts[ ```js let map = L.map('map').setView([51.505, -0.09], 13); let options = { maxZoom: 18, attribution: 'Map data © <a href="https://www.openstreetmap.org/copyright">OpenStreetMap</a> contributors, ' + 'Imagery © <a href="https://www.mapbox.com/">Mapbox</a>', id: 'mapbox/streets-v11', tileSize: 512, zoomOffset: -1 }; let tiles = L.tileLayer('https://api.mapbox.com/styles/v1/{id}/tiles/{z}/{x}/{y}?access_token=pk.eyJ1IjoibWFwYm94IiwiYSI6ImNpejY4NXVycTA2emYycXBndHRqcmZ3N3gifQ.rJcFIG214AriISLbB6B5aw', options).addTo(map); ``` <script> let map = L.map('map').setView([51.505, -0.09], 13); let options = { maxZoom: 18, attribution: 'Map data © <a href="https://www.openstreetmap.org/copyright">OpenStreetMap</a> contributors, ' + 'Imagery © <a href="https://www.mapbox.com/">Mapbox</a>', id: 'mapbox/streets-v11', tileSize: 512, zoomOffset: -1 }; let tiles = L.tileLayer('https://api.mapbox.com/styles/v1/{id}/tiles/{z}/{x}/{y}?access_token=pk.eyJ1IjoibWFwYm94IiwiYSI6ImNpejY4NXVycTA2emYycXBndHRqcmZ3N3gifQ.rJcFIG214AriISLbB6B5aw', options).addTo(map); </script> ] ] ??? JavaScript is quite readable, try and figure out what people are doing, copy and change as needed. JavaScript does have it’s problems though - there are good and bad parts. --- # Data formats .pl[ While some web applications allow uploading of esri shapefiles and tables, most WebMaps require data in JSON/GeoJSON format or structured/table text format (e.g., CSV, TSV, etc.). We will only work with JSON, GeoJSON, and structure data files (e.g., CSV). ] .pull-right[ ## JSON JSON is both human and machine readable data storage. It can be natively used or read by JS. Other languages can read and write to JSON. ```js { "squadName": "Super hero squad", "homeTown": "Metro City", "formed": 2016, "secretBase": "Super tower", "active": true, "members": ["Molecule Man", "Madame Uppercut", "Eternal Flame" ] } ``` <script> { "squadName": "Super hero squad", "homeTown": "Metro City", "formed": 2016, "secretBase": "Super tower", "active": true, "members": ["Molecule Man", "Madame Uppercut", "Eternal Flame" ] } </script> .source[[Mozilla](https://developer.mozilla.org/en-US/docs/Learn/JavaScript/Objects/JSON)] ] --- # A deeper understanding .pull-left[ Don’t be too worried about memorizing all this now. Focus on being able to understand it. You can always replicate by copying and modifying. **The most important is understanding the linkage between folder/files and how they relate to html, css, js, and other data files.** While IDEs can be helpful, there are tools built into web browsers to better **understand** how things function and what may be going wrong. **The developer console is your best friend!** You will encounter problems. Without these (debugging) tools it is difficult to understand where the problem lies. ] .pr[ <iframe width="560" height="315" src="https://www.youtube.com/embed/F7IZZXQ89Oc?rel=0" frameborder="0" allowfullscreen></iframe> .source[Spinal Tap] ] --- # Developer Tools .pull-left[ Most browsers have developer tools. These can be enabled in a variety of ways depending on your computer and browser. Try the following: - PC/Linux - `Ctrl+Shift+I` - Mac - `Alt+Command+I` - F12 - Tools -> Web Developer Tools*  Firefox developer tools. ] .pull-right[ The are four tabs that are of importance for us: - The **Pick** tab/button allows you to focus in individual elements. - The **Inspector/Elements** tab allow you to browse the HTML source code and understand how elements are constructed. - The **Console** tab is where JavaScript information is provided, such as errors, warnings, or just text to help the developer debug/check their code. - The **Network** tab shows us what/who the browser is communicating with and what it is sending and receiving (or failed receiving).  Chrome developer tools. ] ??? * Or some similar combination of menus. --- # Revisited .pull-left[ ## Leaflet Example Let’s reconstruct how the [Leaflet example site](https://leafletjs.com/SlavaUkraini/examples/quick-start/example.html) generates a WebMap by using the Developer tools. - Open the Developer tools - Look at the Network tab, you will need to refresh the page to see what/how the page loads. <hr> ## Airports and flight Paths Let’s revisit the [airports and flight paths map](https://www.arcgis.com/apps/View/index.html?appid=6f53ca5e2b8c480888e96e5f71929c08) again but using Firefox/Chrome's developer tools: ] .pull-right[ - Look at the downloaded tiles in the network tab. Specifically note their sources. - Click the item to gain more information in a side panel. - Note that tile URL paths vary. These are the X, Y tile coordinates and Z is the zoom level. - Tip: Use the Clear tool (garbage can/bin) on the network tab to clear past network requests. - By hovering over the file name in the main network tab you can preview the file. Go through a few/many, you should see there are multiple types. How many types of tiles do you see? What strategy is the map using to display content? - Using the element selector/pointer, the left-most tab, try to select some of the map features. What can you deduce from this? How are the circle/paths features different? ] --- class: inverse, center, middle, activity # Activity - fixing a broken site Working with a partner: [Download](https://github.com/serialc/webmaps_introduction/blob/main/rsrcs/l1/filepaths/ex1.zip?raw=true) this file. **Extract/unzip it!** Try to repair the paths/folders so the Leaflet example from before functions. *Follow the bread crumbs starting from the **index.html** file* --- class: inverse, center, middle, activity # Answers .pull-left[ Note that debugging a website on a proper server (http://localhost/~cyrille/exercise1/) is much easier than an html file on your local machine (file:///home/cyrille/Downloads/ex1/exercise1/index.html). Developer console when opening index.html on a server from a browser:  ] .pull-right[ Regardless, looking through the index file it should be clear there's a mismatch between the actual files provided and the used **relative** paths in index.html. There are a few things to fix. - The path to leaflet.js is wrong - The path to leaflet.css is wrong  - More complex is the missing marker on the map that requires fixing the path within the **leaflet.css** to **marker-icon.png**. - CSS paths are relative to the CSS file. ] --- class: inverse, center, middle, activity # A few points before we close for today --- # WebMaps usually exist in context .pl[ WebMaps should typically be used in a context, such as figures and tables in a document. Some examples: - [Coronavirus in the U.S.](https://www.nytimes.com/interactive/2021/us/covid-cases.html) - [Global Map of 2021 PM2.5 concentrations](https://www.iqair.com/world-air-quality-report) - [Black snow: Sugar cane burning Florida](https://projects.propublica.org/black-snow/) - [Ukraine-Russia war](https://www.hrw.org/news/2022/03/18/ukraine-deadly-attacks-kill-injure-civilians-destroy-homes) - [Russian invasion of Ukraine](https://ig.ft.com/russias-war-in-ukraine-mapped/) ] .pr[ Some WebMaps can contain the totality of the content, mostly in a map. These are okay but are either embedded within apps or often more fun novelties or proof of concepts: - [London Planning Datamap](https://apps.london.gov.uk/planning/) - [Weather Goldilocks zone](https://lukechampine.com/goldilocks/) - [Experiment linking maps](https://vannizhang.github.io/optica/dist/#center=5.946,49.504&layout=vertical,3&zoom=12,14,16) ] --- # Limitations of WebMaps .pull-left[ ## Decay A drawback of WebMaps is that they can depend on a variety of software and data frameworks which change - unlike a static map. While I have created many WebMaps, I stop maintaining them when no longer relevant. As a result they eventually no longer function perfectly or at all. - [Bike-share rebalancing](https://bikeshare-research.org/rebalancing/webmap/) - Broken base map. - [Safe Streets Trafford](https://serialc.github.io/Safe-Streets-Trafford-Explorer/) - Broken double slider/brush. We will learn more about these components, but keep in mind that as browsers (part of the client or front-end stack), mapping libraries, data providers (e.g., Mapbox) evolve, these may break the functionality of your maps. ] .pull-right[ ## Trade-offs When choosing components for your professional projects in the future this may be very important. Selecting the right combination depends on: - acceptable cost, - data type and quantity, - necessary or desired features, - configuration expertise, - ability to use independent data (base maps in particular), - user and medium (PC vs phone or tablet), and - other factors … ] --- # Development tools .pl[ We will need to write and edit HTML, CSS, and JavaScript **code**. **Computers are are very picky about details when reading code**. A stray bracket or typo can break functionality and sometimes be *very frustrating* to resolve. Some programs help you code by indicating when there's problems and assuring that connections between files, such as HTML to CSS, are correct and will give you a warning. These are called integrated development environments (IDE). ] .pr[ I believe you can get sufficient support using [Notepad++](https://notepad-plus-plus.org/) but some students in the past have greatly appreciated using [Visual Studio Code](https://code.visualstudio.com/) by Microsoft. Many other [alternatives exist](https://www.google.com/search?q=ide+for+web+development). Feel free to use either or both as you wish, however I believe only **Notepad++** is available on the lab machines. ] --- # Homework for next week .pull-left[ 1 - [Computer Science Basics with Minecraft](https://studio.code.org/s/mc/lessons/1/levels/1) - Provide a screenshot showing you have completed levels 1-13 (green dots at the top of the screen). 2 - [JavaScript basics](https://developer.mozilla.org/en-US/docs/Learn/Getting_started_with_the_web/JavaScript_basics) - Follow the instructions. 3 - View the source code of the [Leaflet example](https://leafletjs.com/examples/quick-start/example.html). - Identify which portions of the code are HTML/JS/CSS - Identify CSS connections to HTML - Identify JS connections to HTML - Explain the JS code ] .pull-right[ 4 - Using what you've learned and the code examples given in [this presentation](#29) , create a very simple website, it doesn't need to be pretty, provide some superficial information about yourself and, if you wish, include a small picture/caricature of yourself, pet, or something else. Zip up your site files. Don't share any personal information. 5 - Email me the results of steps 1 & 4 above **before** next week's lesson. ] --- # Questions? ## [Contact me](mailto:cyrille.medarddechardon@liser.lu) if you have any questions. cyrille.medarddechardon@liser.lu ## These slides are online https://serialc.github.io/webmaps_introduction/