GNSS/GPS accuracy and error
Sylvain Klein & Cyrille Médard de Chardon
Creation date: 2023-02-02
GNSS accuracy & error
Introduction
A Global Navigation Satellite System (GNSS), also commonly called a Global Positioning System (GPS) which is actually a brand of GNSS, is a relatively easy and affordable way to georeference points. Georeferencing is the process of associating points on the surface of the Earth to a standardized coordinate system. This allows us to say the Eiffel Tower is located at 29.9792° N, 31.1342° E using the WGS 84 geographic coordinate system. This is typically just referred to as a latitude and longitude without any thought to what geographic coordinate system we are using. While lat/long coordinates can be extremely precise the question this resource aims to explore is how accurate are GNSS recording devices and what impacts their accuracy.
As we are focusing on accuracy, let’s clarify the difference between accuracy and precision:
| Value | Measurement | Definition |
|---|---|---|
| 2.4173 | 2.9325 | Precise but not accurate |
| 2.4173 | 2.4 | Accurate but not precise |
| 2.4173 | 2.417 | Accurate and precise |
Here’s an alternative definition example.
Outline
This resource analyses through exploration the accuracy and error of location data collected along a walk through Belval, Luxembourg, using a GNSS device (Crosscall Trekker-M1 Core).
A brief explanation of GNSS
GNSS sensors or devices capture signals from satellites and sometimes base stations to determine their location. The satellites orbit at a distance roughly 20,000 km from the surface of the Earth. The American GPS system with its constellation of satellites was the first GNSS. There are now other GNSS satellite constellations: China’s BeiDou (35 satellites), the EU’s Galileo (24+ satellites), Russia’s GLONASS (24+ satellites), India’s IRNSS (7 satellites), and Japan’s QZSS (7 satellites by 2023).
Some GNSS systems complement existing offers to improve regional sensing (e.g. Japan’s QZSS), while others can function independently. Different GNSS sensors can detect different and multiple satellite constellations. While having much more than 10 satellites ‘visible’ by the GNSS sensor makes little difference, it’s their position that matters more. For this reason, while 20 satellite signals may be sensed by a device, a selection process takes place to optimize which will be used or locked, to calculate a location. Therefore having more satellites available is only beneficial in that it allows the optimizing satellite selection.
Determining the location of the GNSS receiver uses a process called trilateration. This involves determining the distance from multiple objects, in this case satellites. As mentioned, their position will determine the possible error. Distance is determined by very precise clocks in the satellites, broadcasting the time they send out a signal, which is used to calculate the travel time to the receiver.
Below demonstrates an extremely simplified illustration of how satellite angle relative to the receiver and one another will create varying shapes and sizes of error. In this illustration the areas where the circles overlap is the size of the uncertainty. The left frame illustrates what happens when satellites are low on the horizon, versus on the middle frame, when one is at the azimuth and the horizon, and finally the right frame when two satellites are overhead.

Figure 1: Satellite configurations and the resulting shapes and areas of inaccuracy.
With this basic introduction to how GNSS receivers determine location and satellite location can impact this, we will take a look at some actual data to see how it varies relative to actual locations. Due to how GNSS receivers operate many other factors can influence their accuracy.
A walked path
Below is a walked tour through and in the vicinity of Belval (Luxembourg), starting in the east next to the furnaces, going along the shopping centre, then around the Park to the west and returning, ending in front of LISER’s and the University of Luxembourg’s Maison des Sciences Humaines (Social Sciences building).
Note that the walked path starts and ends in an urban area with tall structures, with some travel through open spaces.
While a smartphone and app was used to record location, the app uses NMEA data which is not the same as typically using smartphone location data. Smartphones apps, such as Google Maps or Navigation, typically use other or additional means to estimate location that consume less battery power: - proximity to cellular towers - proximity to Wi-Fi hotspots
Requirements for needed accuracy and availability of the above alternatives obviously determine whether GNSS processing will be used to provide accurate geolocation.
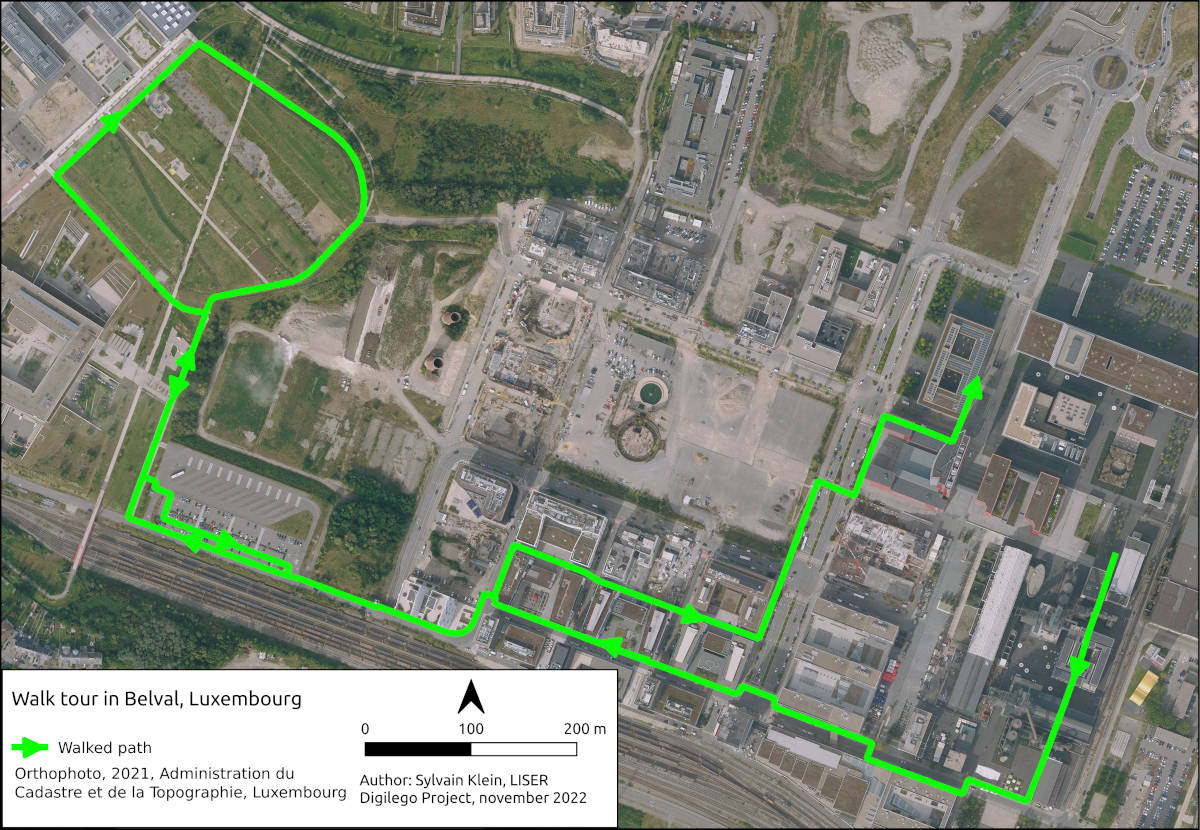
Figure 2: Trace of walked path.
The above figure illustrates the route walked (green line) which was manually digitized using QGIS. This will serve to compare and evaluate the recorded or sensed GNSS location.
The sensed path - GNSS data
GNSS devices decode satellite signals to determine their location. The signals contain three data parts:
- A unique identifier (the spacecraft vehicle number - SVN)
- The time the signal was sent
- The implicit location of the satellite (the orbit/ephemeris and location on it - sort of)
The decoding process locates, with some error, the device’s location and elevation relative to the Earth’s sea-level equivalent by determining the satellites distances (the trilateration process). This decoding process creates a diversity of data, such as device location (lat/long), elevation, and various error measures, among others.
This generated data, in its raw form, is called NMEA data after the organization that defined the standard, the National Marine Electronics Association. There are different versions of the standard. Rather than nicely structured, NMEA data can be quite messy or corrupted and needs further refinement before being easily usable. Many devices and data analysis tools will process the NMEA data for you so that it is already comprehensible in data or visual form.
$GPGSA,A,3,02,04,05,06,07,09,11,16,20,29,30,,1.0,0.6,0.8*3B
$GPVTG,120.2,T,120.2,M,2.9,N,5.4,K,D*2C
$GPRMC,113627,A,4930.382271,N,00556.308064,E,2.9,120.2,271022,1.1,W,D*0E
$GPGGA,113627,4930.382271,N,00556.308064,E,2,11,0.6,312.0,M,48.0,M,,*47
$GPGSV,3,1,12,02,09,327,35,04,19,071,34,05,10,303,34,06,36,210,33*7D
$GPGSV,3,2,12,07,62,146,42,09,56,067,37,11,47,258,36,16,13,045,36*7A
$GPGSV,3,3,12,20,46,298,34,26,01,021,31,29,05,329,30,30,35,189,30*79
$GLGSV,2,1,08,66,14,284,28,73,17,025,40,75,30,143,41,65,63,324,33*6F
$GLGSV,2,2,08,88,30,251,37,81,29,314,27,72,46,073,35,87,06,209,*6A
Code snippet 1: Some NMEA data sentences.
We captured the NMEA sentences with an Android smartphone App called NMEA Tools Version 2.7.35. The NMEA data was processed using a Python script to extract the lat/long points and other data. Depending on your device multiple GNSS constellations may be captured.
Besides lat/long data, NMEA data also contains: - Relative angles of GNSS satellites visible/detected - Satellites used to determine the sensor’s location - Error of the location measurement - Movement speed and bearing/direction
In the figure below the lat/long points are added to the map of the walked path.
Note that point data can as easily be mapped or graphed as lines as well as points. While using lines is beneficial in showing continuity, sequence, or direction, lines can also obscure points that communicate information, such as the accuracy of data (a straight line can either mean a straight path or missing data) or changes in speed (the difference in distance between points recorded at regular time intervals).
The maps and figures will show point and line data as appropriate.
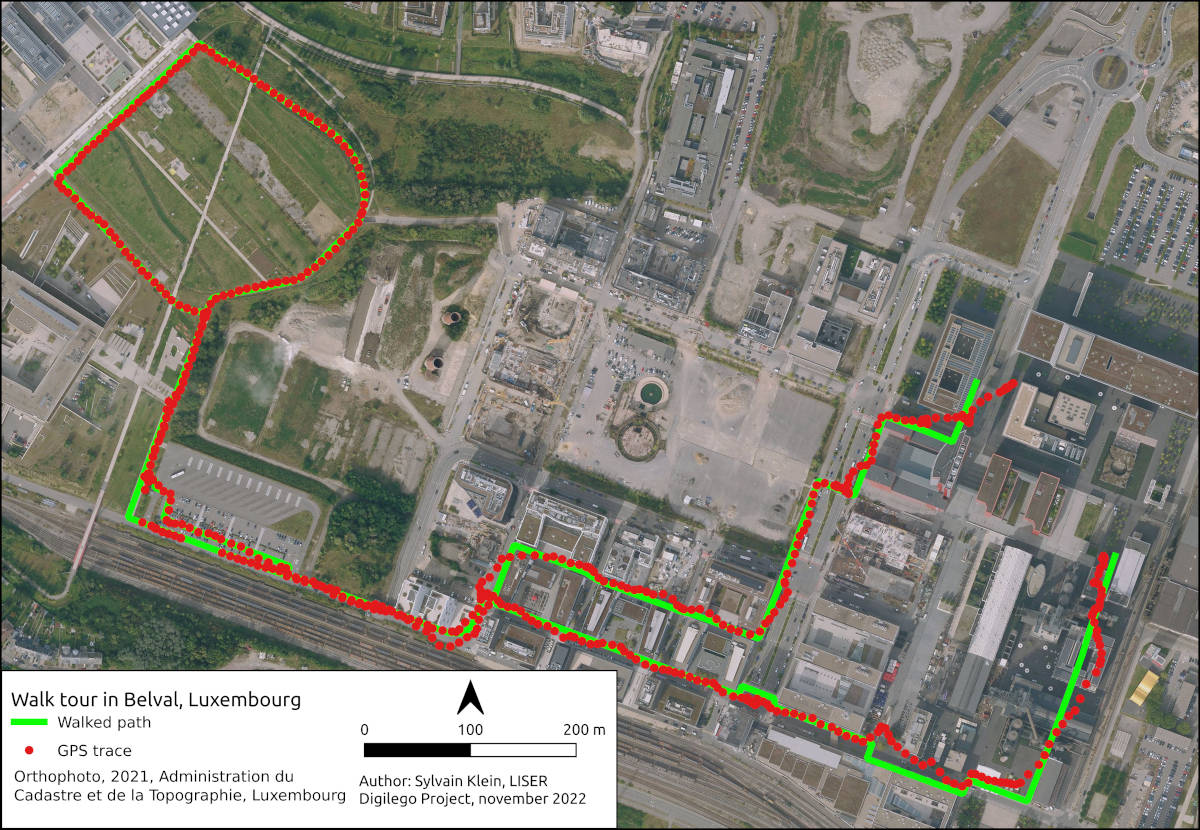
Figure 3: Overlay of GNSS sensed path over walked path.
In the figure above we see the device-sensed path data following closely the taken path in the western area, but less so in the south-eastern half where more buildings are present.
Temporally, in the graph below, we can see that there is a lot of deviation from the taken path at the start and end of the walk.
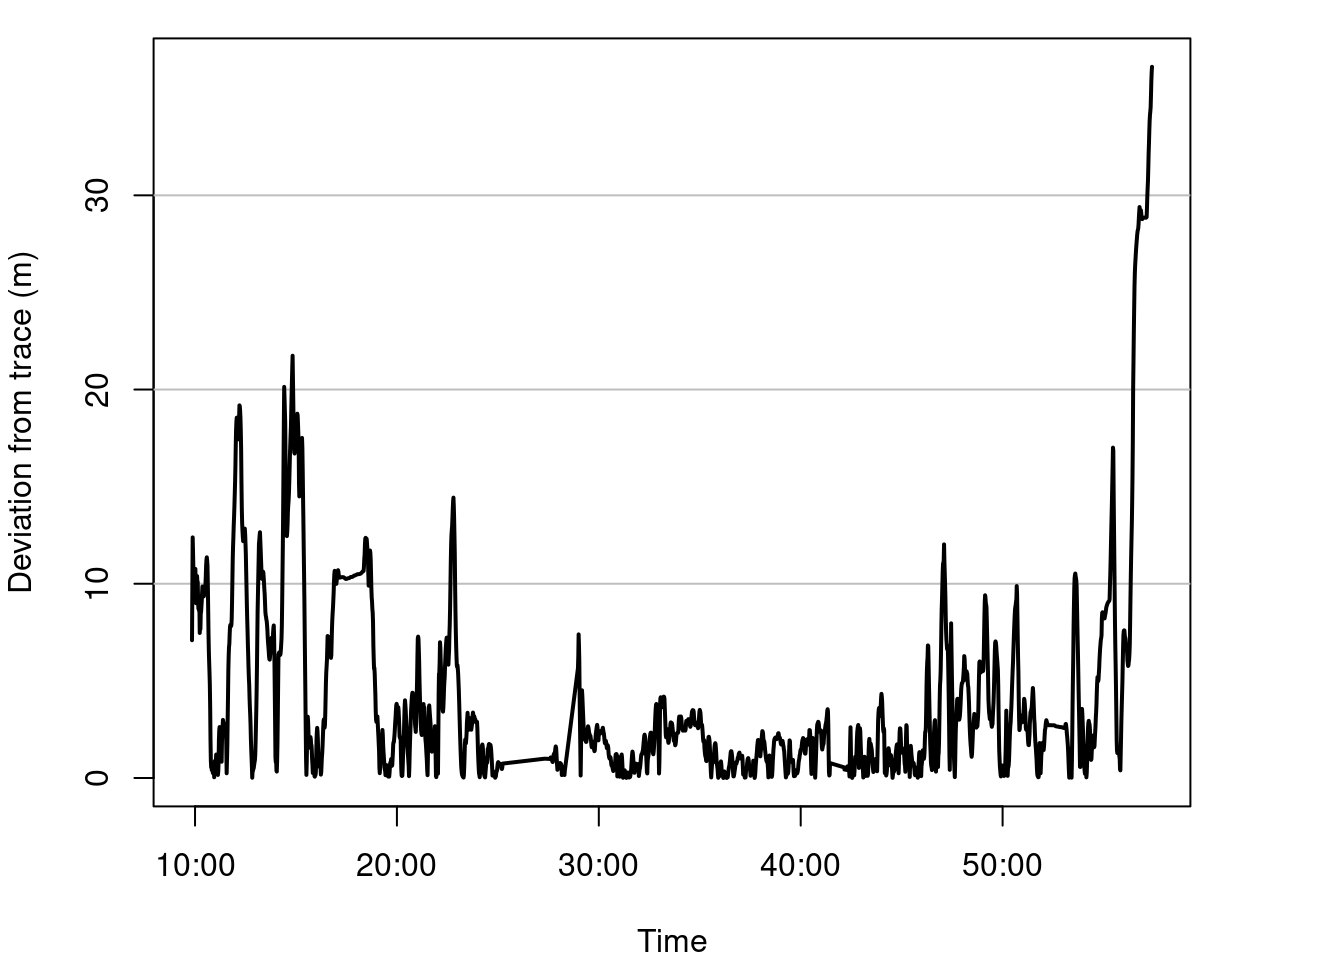
Figure 4: Plot of distance error between traced and sensed paths over time.
What causes error?
Since GNSS accuracy depends on receiving satellite signals, interference between the sensor and the signals will increase error. Buildings are a common cause of location error, but weather, forests, the atmosphere, and topography can also degrade, refract, reflect, or block satellite signals, reducing the location accuracy.
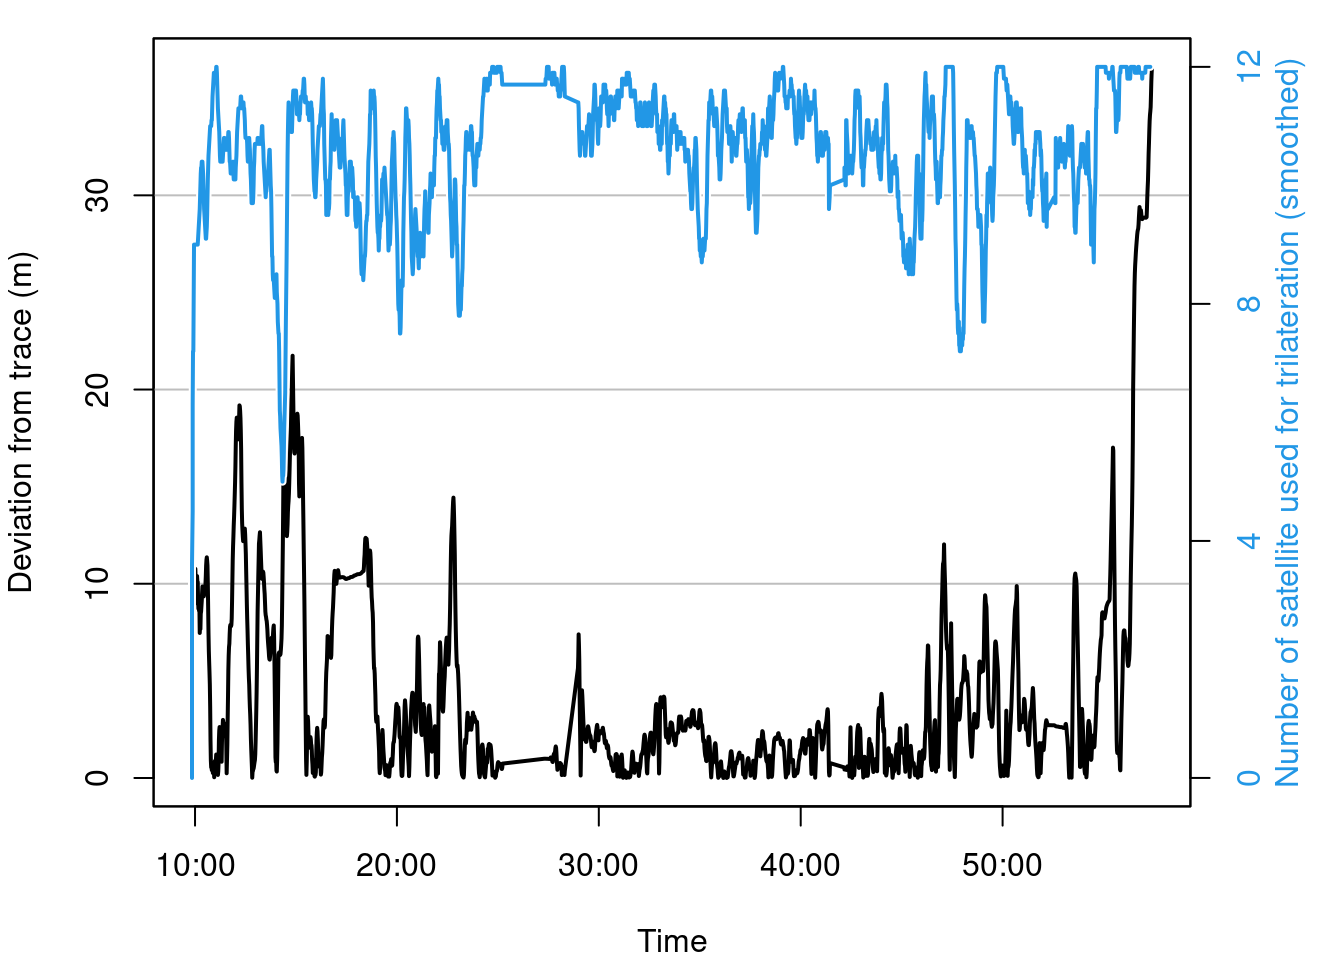
Figure 5: The error and number of satellites used to locate the sensor.
It appears that the number of satellite signals received decreases at times of higher error. This can be misleading however, as a received signal can still be delayed and/or reflected. So this may not be an effective means of measuring (in)accuracy.
As buildings interfere with GNSS precision let’s visualize building heights along the walked route.
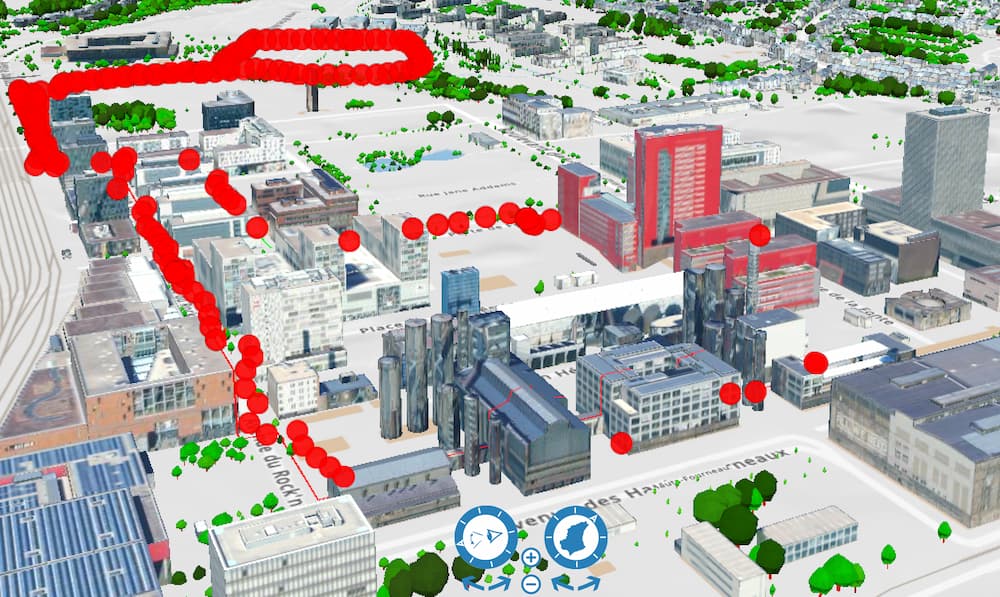
Figure 6: A capture of the sensed and walked paths visualization.
Rather than explore this visually, we can view this graphically by comparing surrounding building heights with error. Below, the mean building heights within 50m of each recorded location is graphed with the error distance.
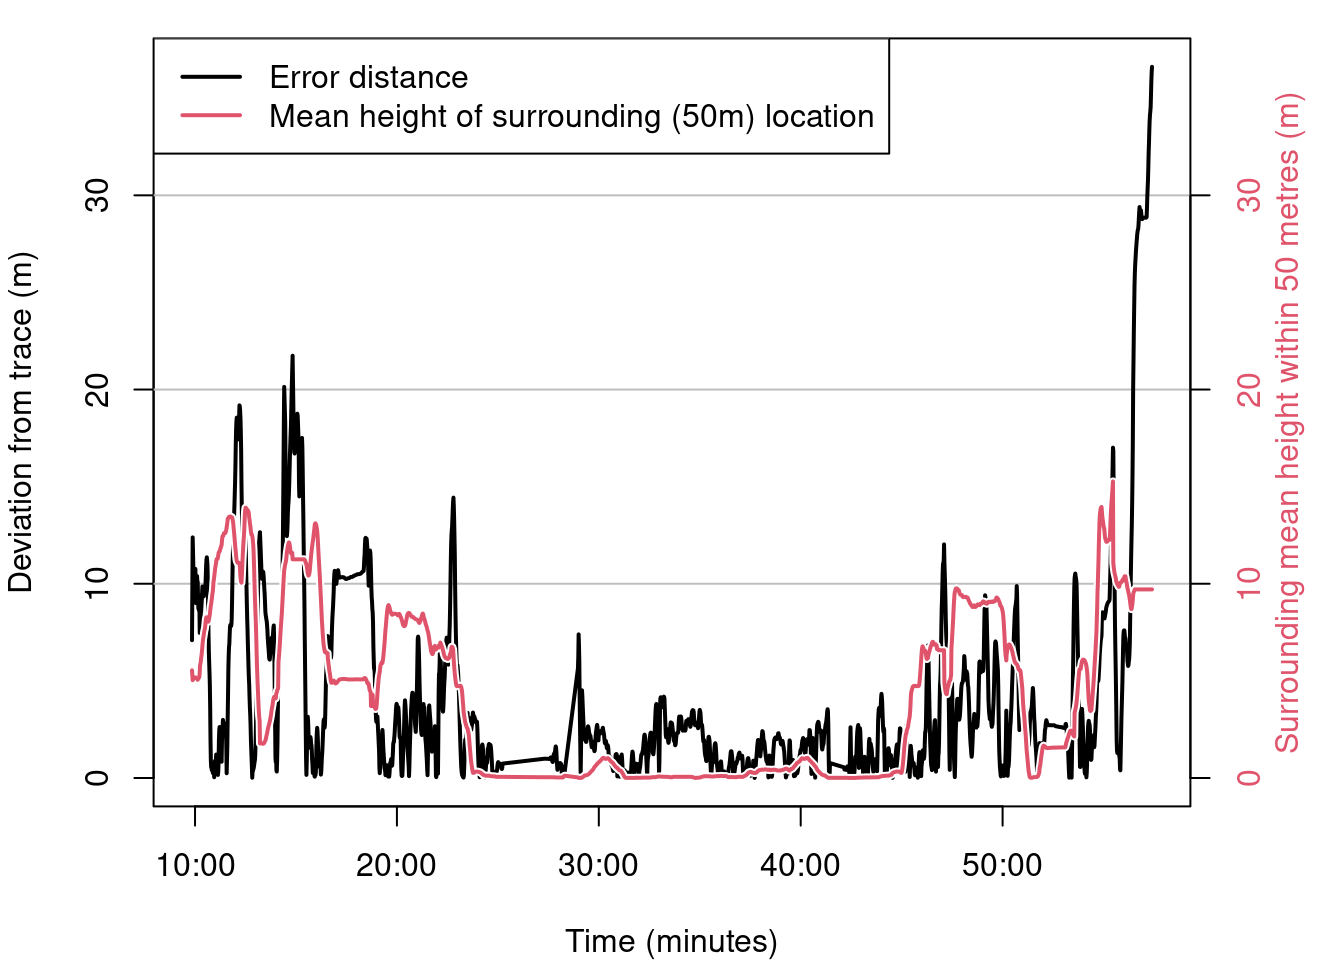
Figure 6: Plot of surrounding building heights and error along the walked path.
Clearly the distance between the known path and the sensed path, increases according to average building heights, as expected.
High structures reduce the GNSS device accuracy.
The number of satellites
As mentioned in the introduction, GPS, is the brand of the American GNSS system. Other systems exists such as GLONASS (Russia), Baedou (China), and Galileo (EU). As location accuracy is dependent on getting good satellite reception in desirable configurations, clearly having more satellites accessible can be beneficial. Some GNSS devices can track multiple satellites types.
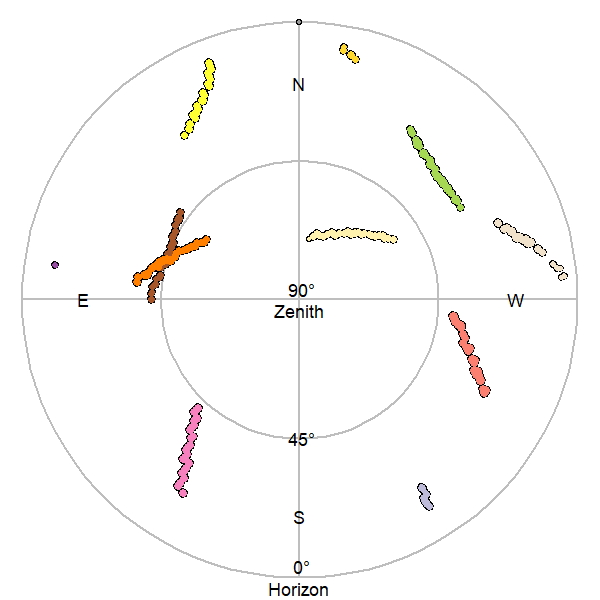
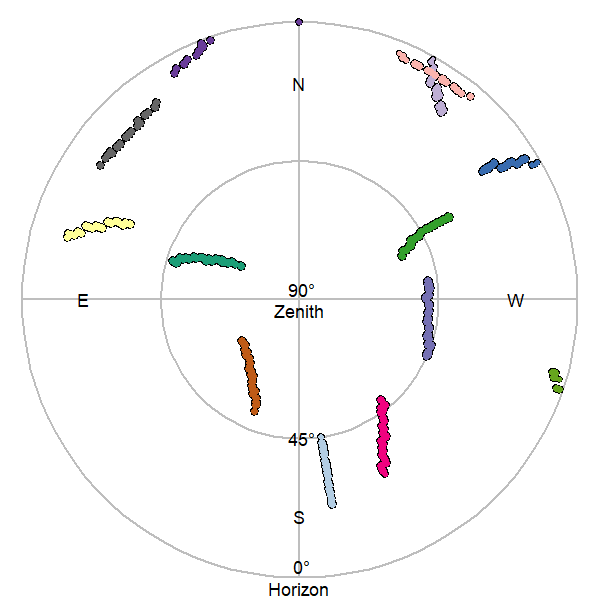
Figure 7: Sky plots of GLONASS (left) and GPS (right) satellites in view while completing walk.
While the East and West are perhaps reversed to expectations, consider these plots as the views when you look up at the sky.
Dynamic satellite selection
While many satellites may be detected by a GNSS device, only up to 12 are used to calculate location. Depending on satellite reception, and optimal angles, the selection of used satellites to determine the receiver’s location changes as the device and the satellites move over time.
Figure 8: The movement and selection of satellites used during the Belval walk. The perspective here is top-down, like looking at a map.
We can observe if it’s possible to see a pattern in satellite selection based on where the device is as it moves along the walk in the video below.
Video 1: A video of the walked and sensed paths synchronized with the satellites in view and used to calculate location.
Which satellites are used?
With this device and for this walk both GPS and GLONASS satellites were detected.
It’s possible to compare which types of satellites are more available and also actually used for location determination.
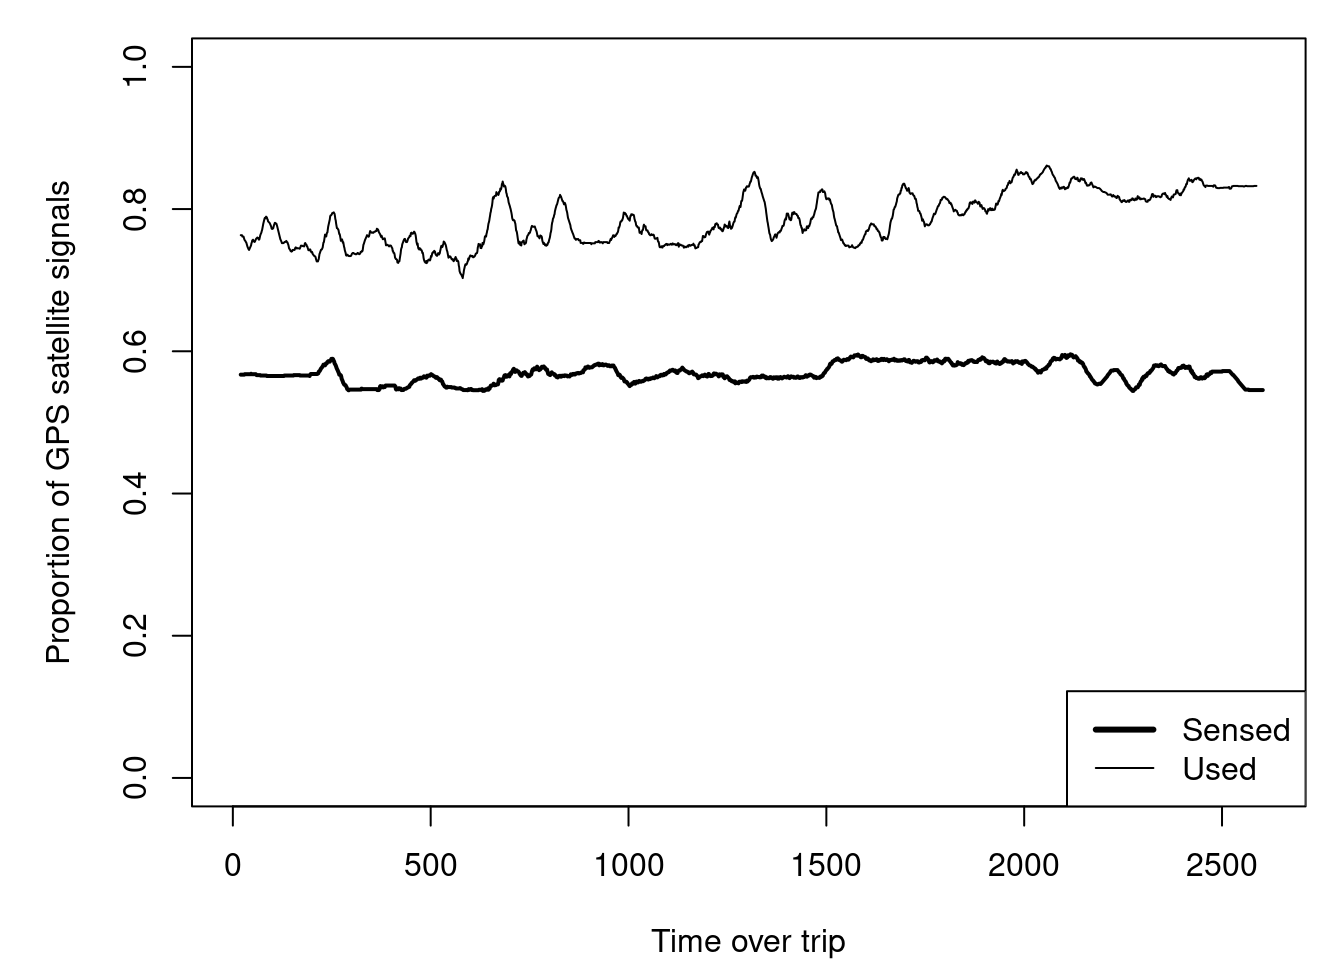
Figure 9: During the walk the GPS constellation provided 50-60% of the satellites with the remainder belonging to GLONASS. Despite this about 80% of the satellites used to determine location were from the GPS constellation with the remainder from GLONASS.
This GNSS receiver uses GPS signals more than GLONASS. Why might this be the case?
DOP measures
We have spend lots of time comparing the sensed location to the actual estimation of the travel path. Fortunately there may be an easier way.
NMEA data contains Dilution of Precision (DOP) measures. There are three: - Vertical DOP (1D) - Horizontal DOP (2D) - Position DOP (3D)
Lower DOP values are better. The values can range from under 1, which are ideal, to over 20, being very poor. Dilution of precision integrates the number and position of satellites to determine the likely accuracy of the location measurement. These measures simply take into account what we have already discussed, the number and relative position of satellites and their signals to your GNSS sensor device.
Looking again at Figure 1, consider how different satellite positions could impact DOP types differently.
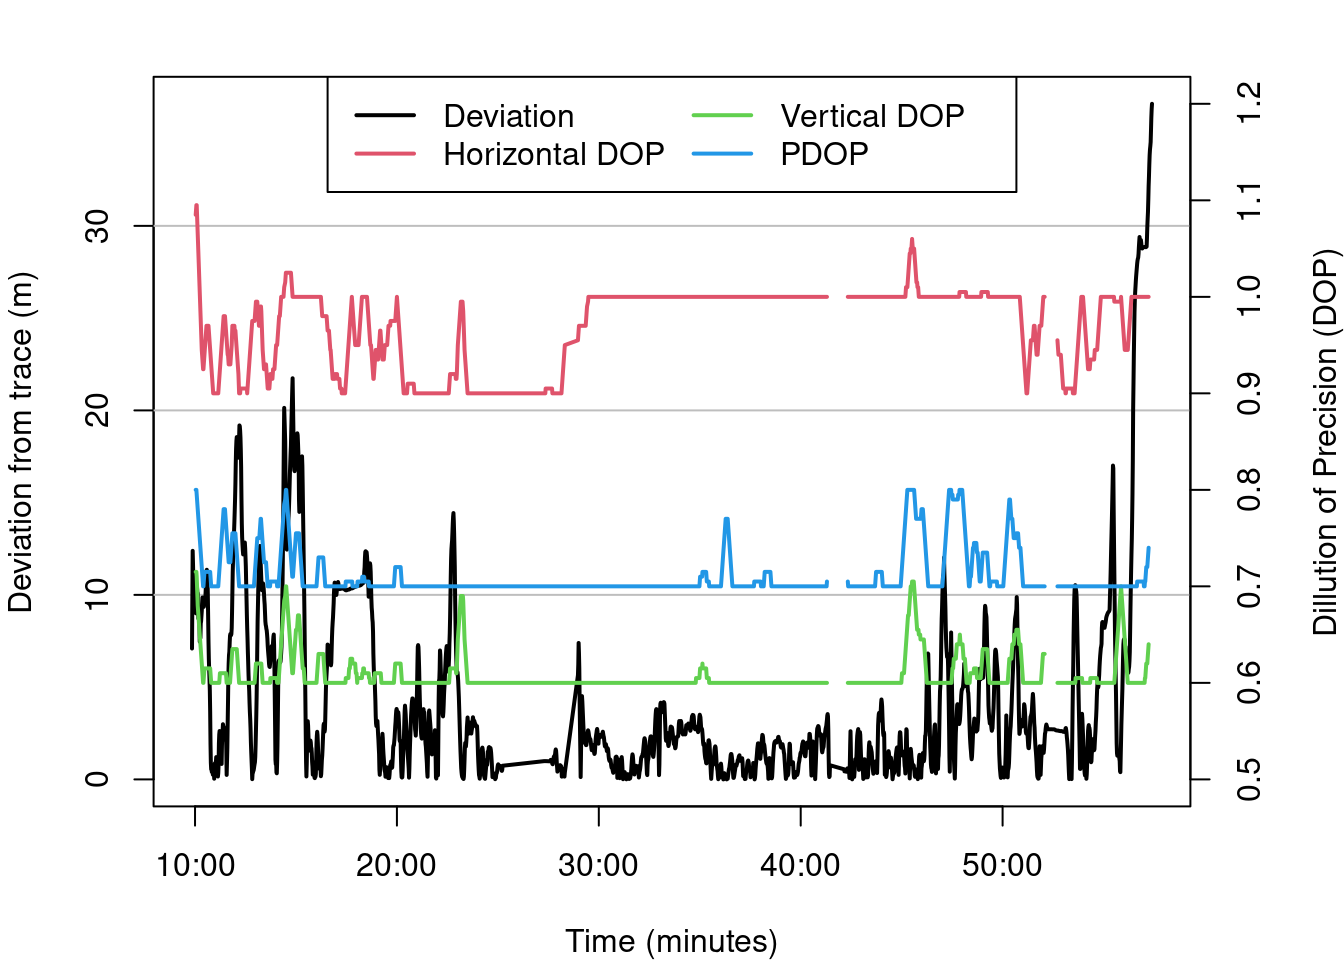
Figure 10: Different DOP values along the walk. DOP fluctuations are higher when positional error is greater.
Despite the DOP values in the figure above having just been labelled as ‘good’, the figure above shows that small increases can quickly augment the error distance (deviation).
Conclusion on GNSS accuracy and errors
We have explored a variety of error sources along a walked path. The intent was to highlight the limits to GNSS accuracy and some of the causes. In practice GNSS can be used to measure certain features with non-trivial error, depending on the needs. Alternatives exist to improve accuracy, such as differential GNSS, or pricier surveying equipment. But for accurate, affordable, and independent (i.e., non-technical or system dependent) low-tech solutions exist, such as using measuring tapes and compasses combined with trigonometric operations.
Notes
Created by Sylvain Klein & Cyrille Médard de Chardon in 2022-2023 as part of the Digilego project.
Some used & alternative sources
GPS.gov aprs.gids.nl/nmea gpsd.gitlab.io/gpsd/NMEA.html gisgeography.com