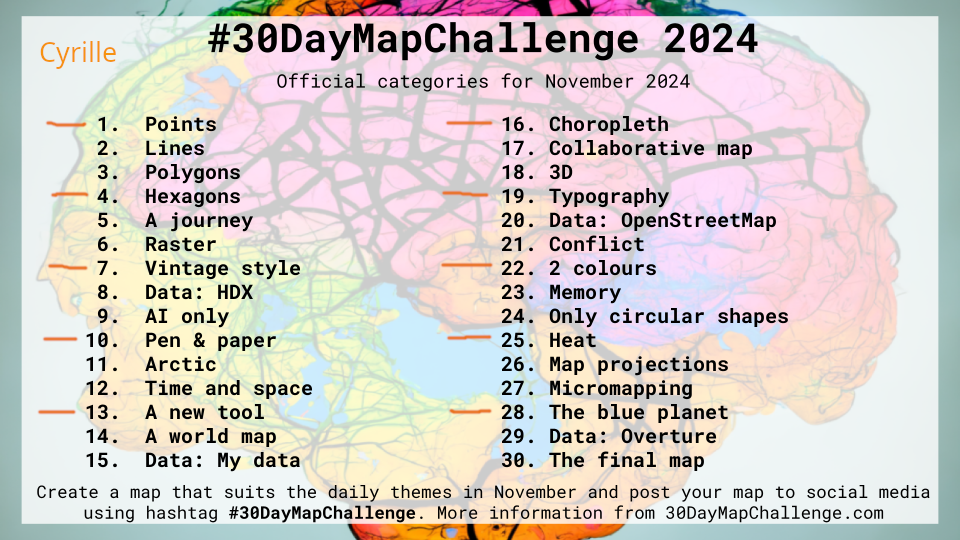
30DayMapChallenge
2024 Maps
I am doing the #30DayMapChallenge with work colleagues Léandre and Sylvain. I will only be doing every third day.

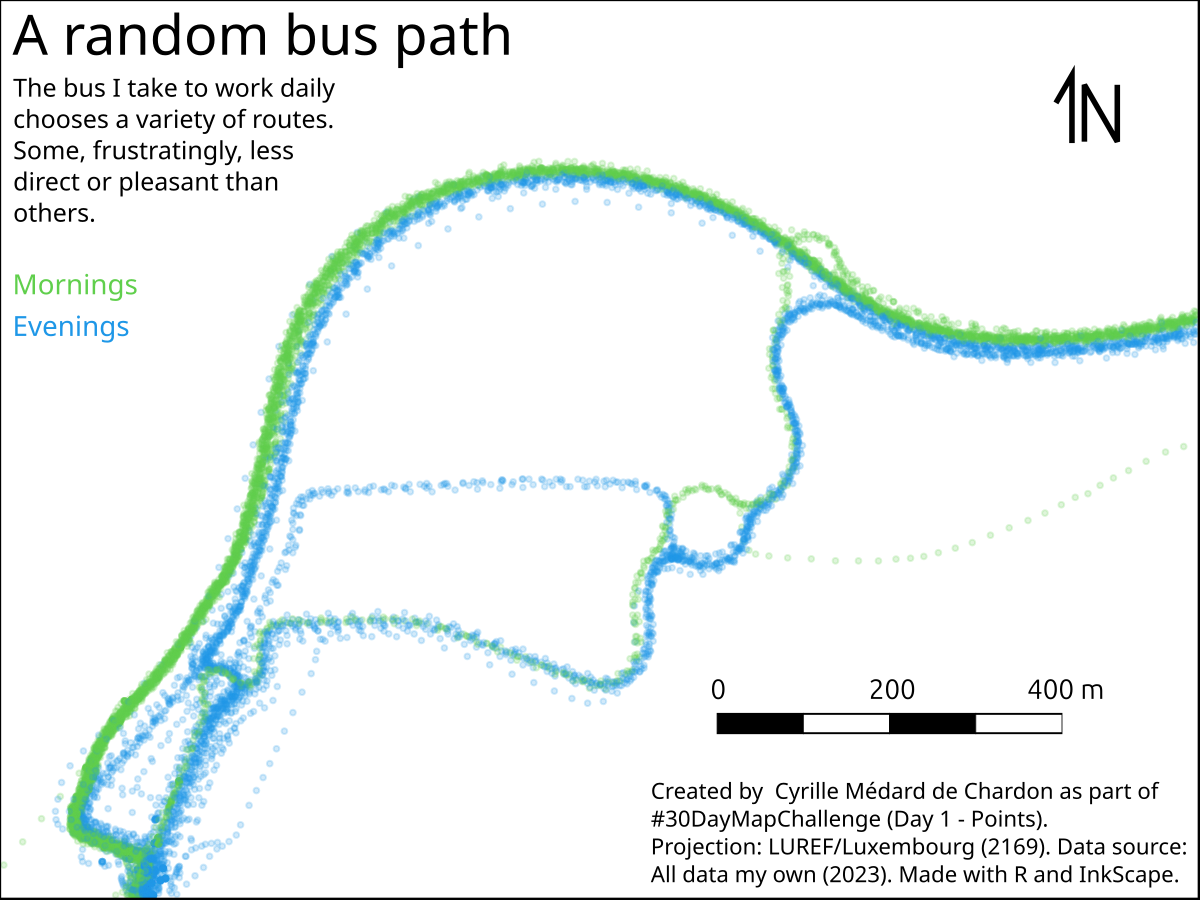
Day 1 - Points
Used R to connect to MariaDB and extract data - very effective. Converted to sf and plotted, saving as SVG.
Completed layout in Inkscape.

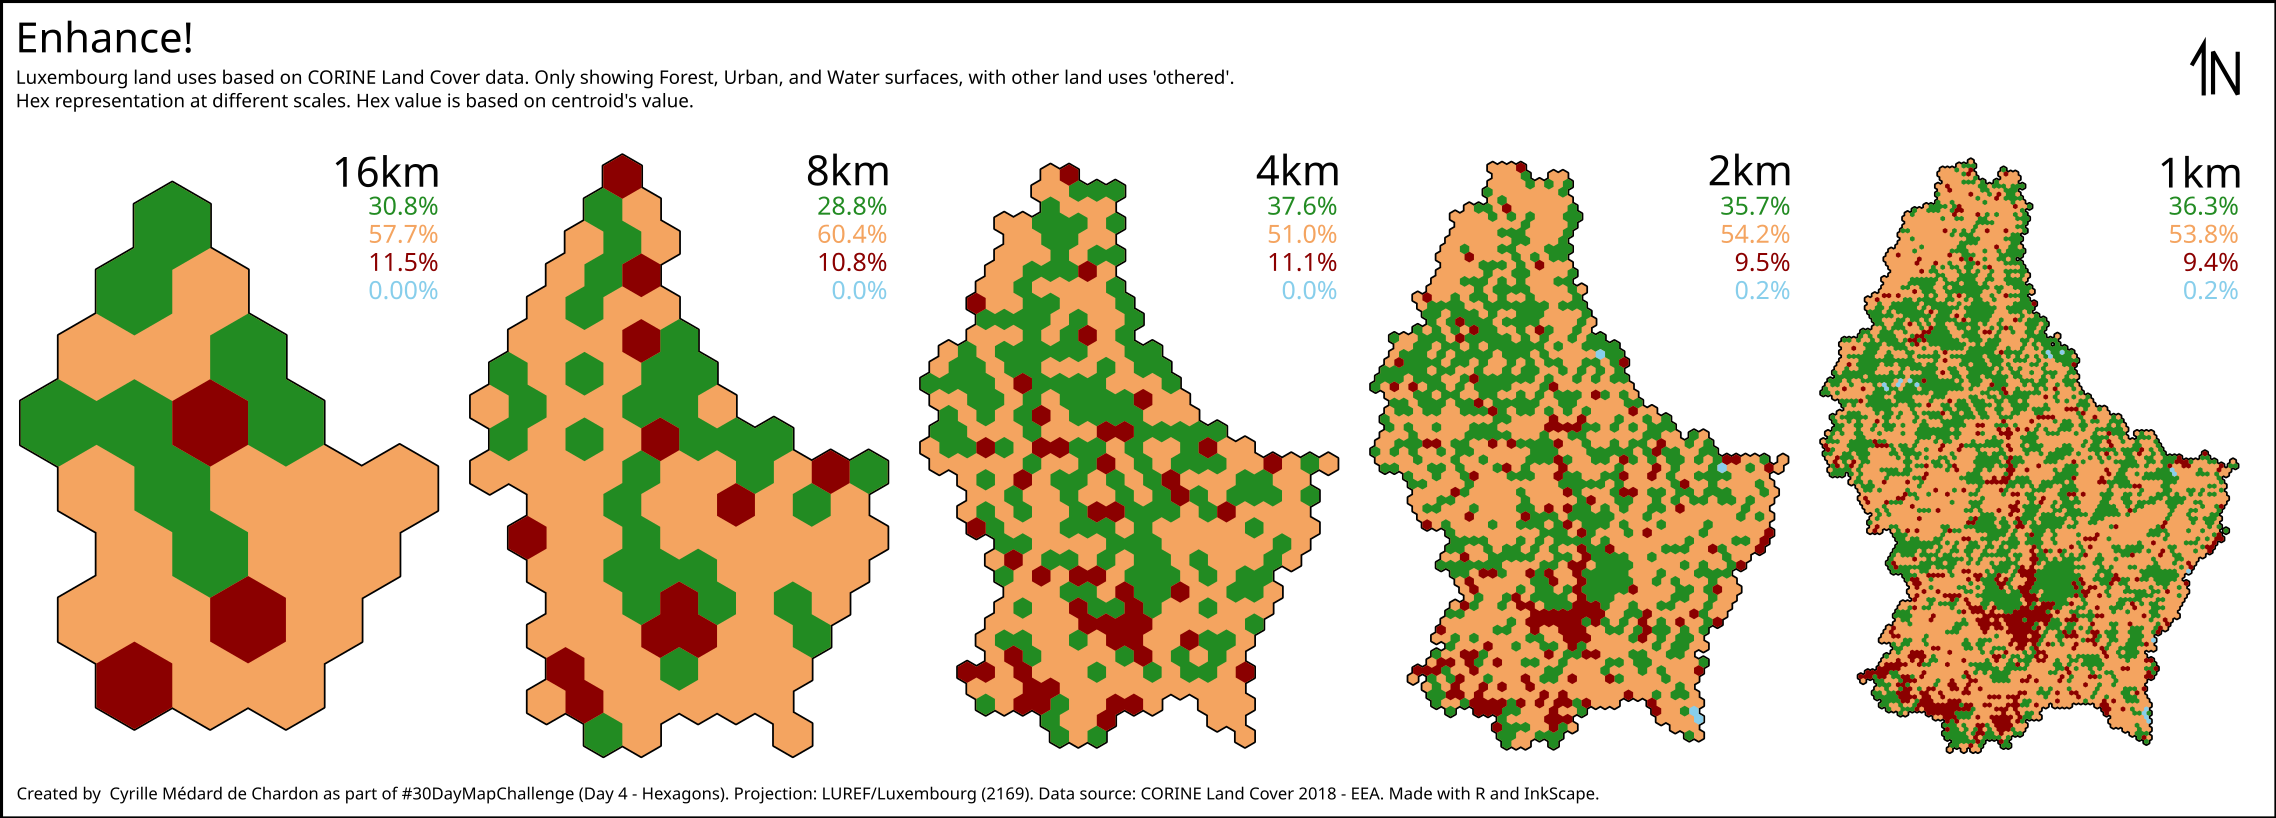
Day 4 - Hexagons
Used R to modify the raw Corine Land Cover (CLC) data, create hexagons, used centroids to sample CLC. Used QGIS to reclassify as I was planning on doing something similar to Day 10 from 2023. Layout was exported from R, just some text added in Inkscape.

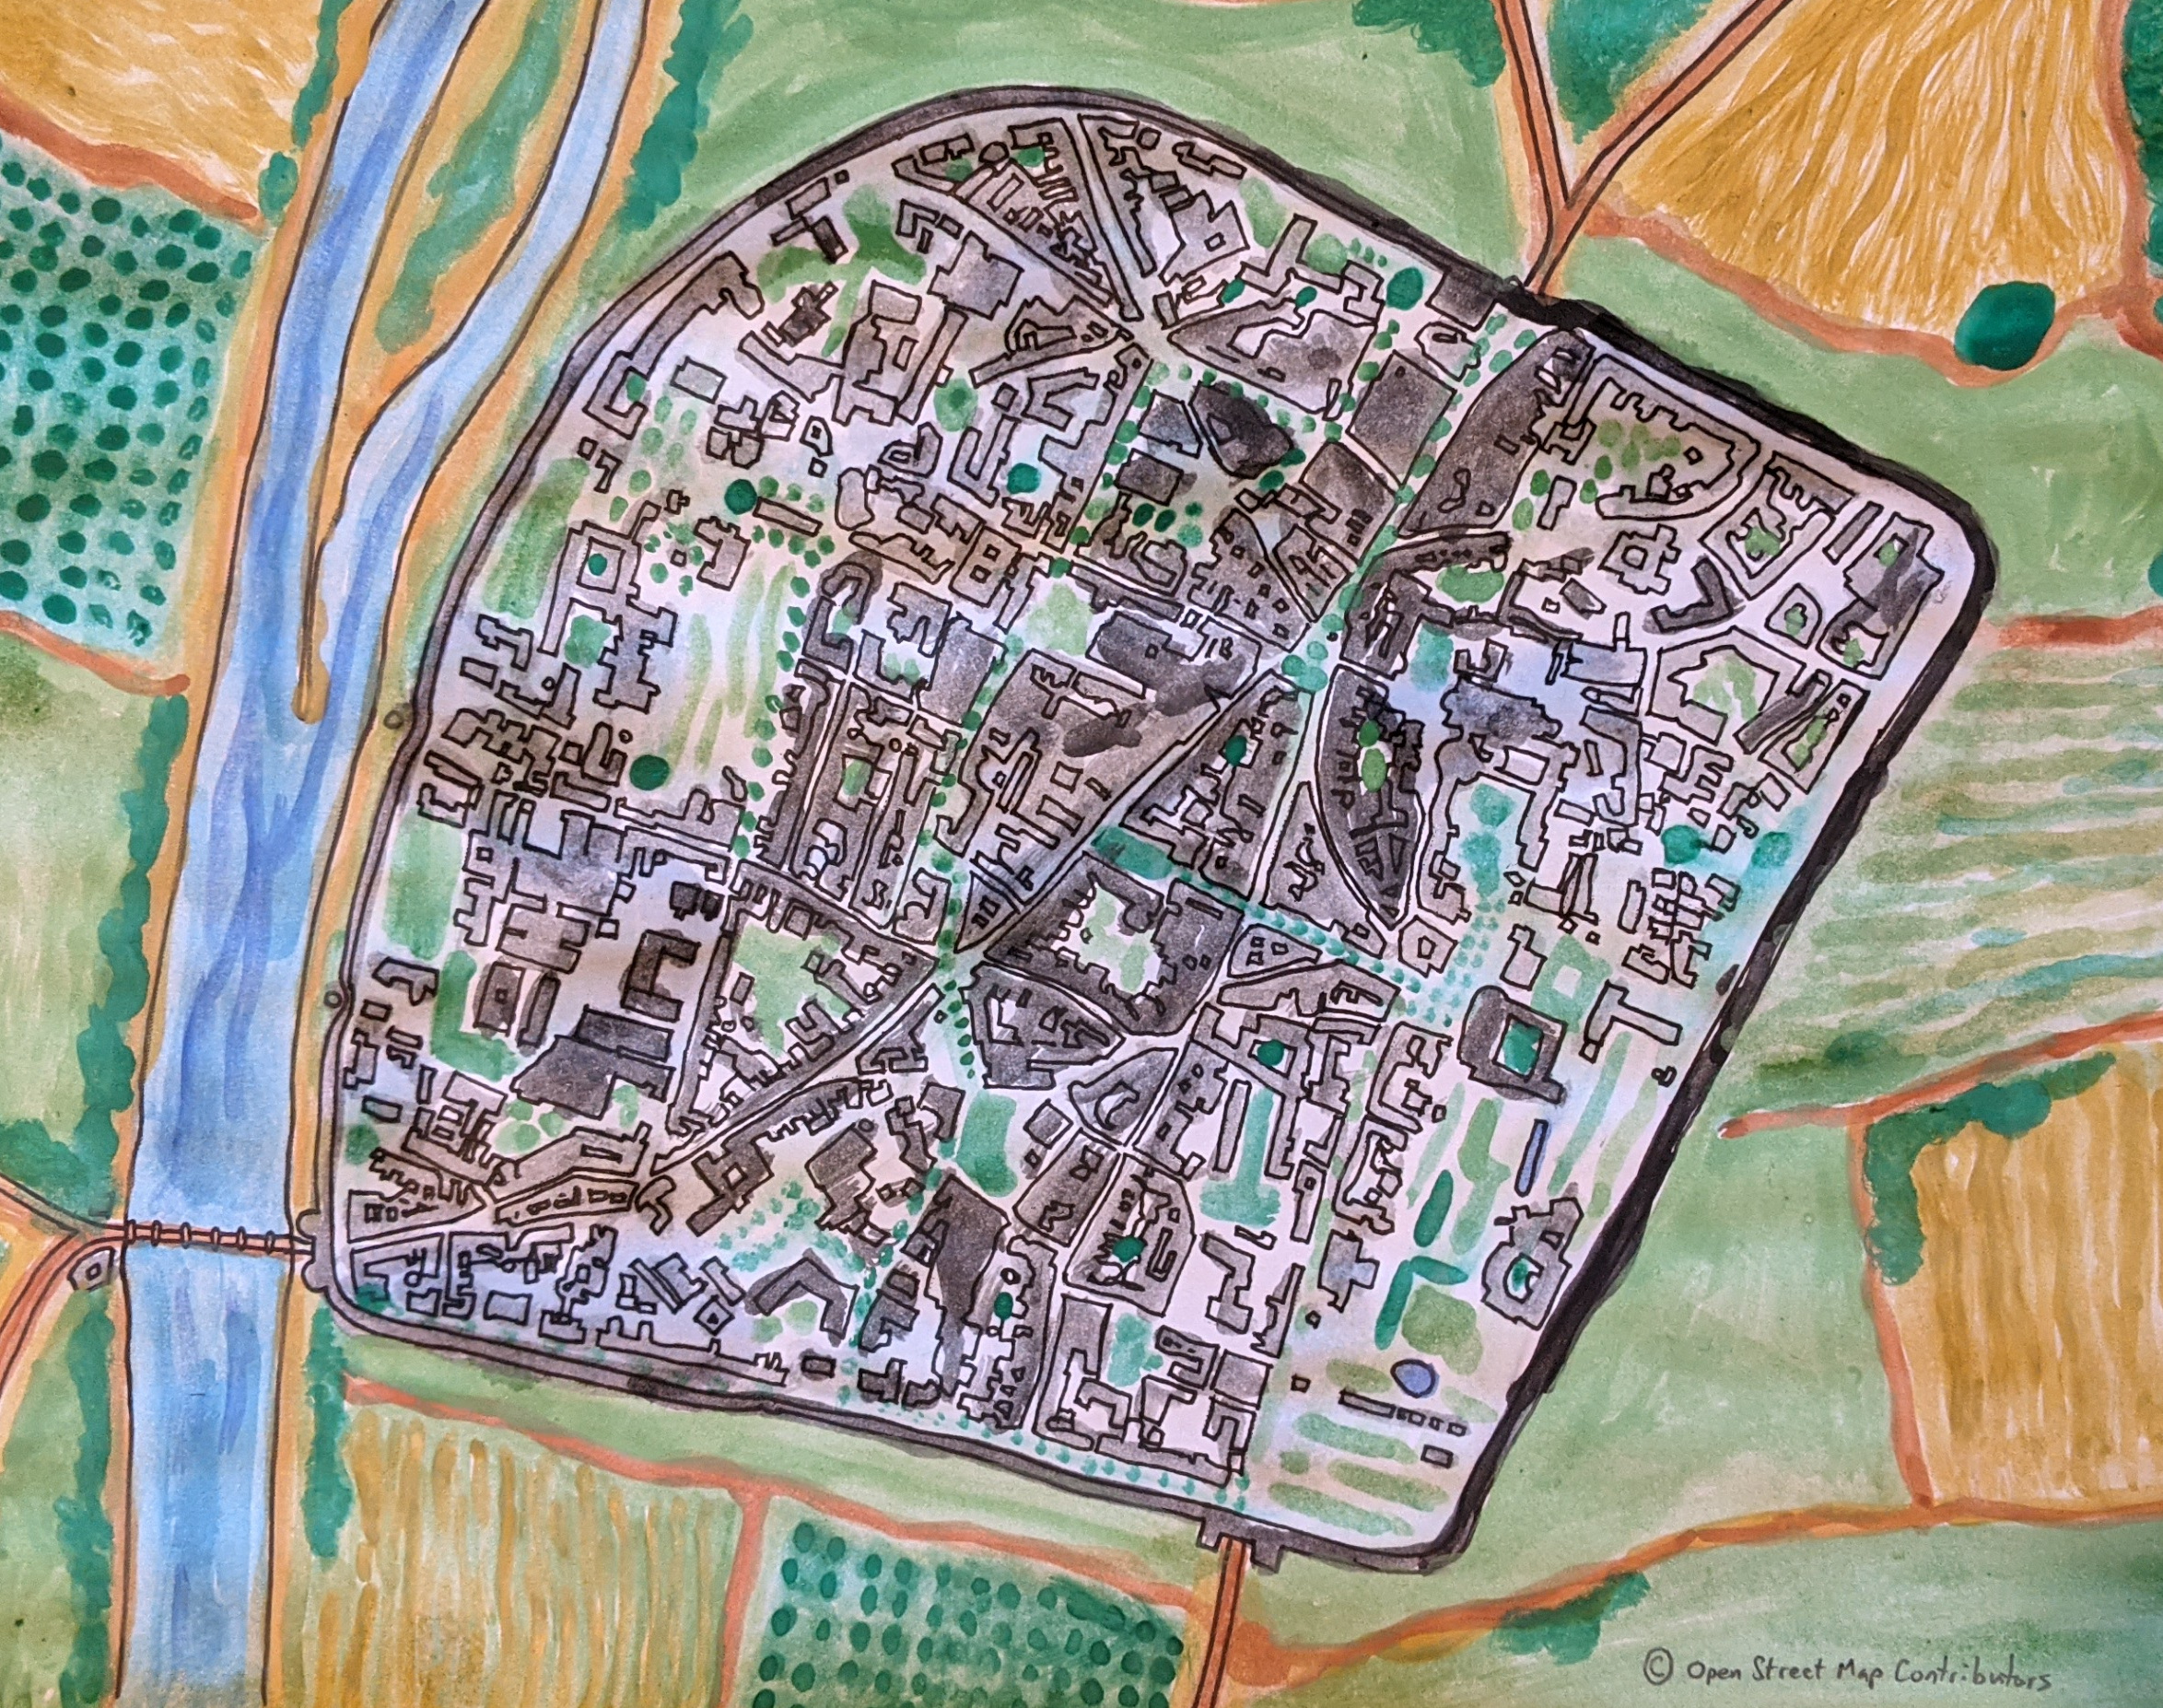
Day 7 - Vintage style
I wanted to do something ‘vintage’ and though I could do it by hand - didn’t quite come out in the correct style.
I made of map of the Trier city centre buildings and Moselle from OSM data, removed everything else and made the surrounding area green. Also added the old city wall.
